Dataflow Monitoring
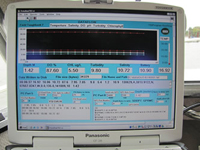
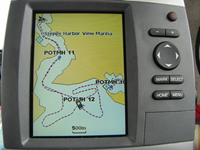
Dataflow is a compact, self-contained surface water quality mapping system, suitable for use in a small boat operating at speeds of about 25 KT. The system collects water through a pipe ("ram") deployed on the transom of the vessel, pumps it through an array of water quality sensors, and then discharges the water overboard. The system collects samples approximately once every 3-4 seconds. The DATAFLOW system utilizes a YSI 6600 multiparameter, sonde equipped with a flow-through chamber which gives readings on water temperature, salinity, pH, chlorophyll, turbidity, and dissolved oxygen. The sonde transmits data collected from the sensors directly to a 600 MHz embedded computer board contained in a waterproof Pelican case using a data acquisition system created with LabView software (National Instruments, Inc.). Custom software written in the Lab View environment provides for data acquisition, display, control, and storage. Real-time graphs and indicators provide feedback to the operator in the field, ensuring quality data is being collected. The system is also equipped with a Garmin GPSMAP 168 Sounder. This unit serves several functions including chart plotting, position information, and depth. The unit is WAAS (Wide Area Augmentation System) enabled providing a position accuracy of better than three meters 95 percent of the time. DATAFLOW cruises take place once a month in each of the Chesapeake Bay Program Segment of interest. Two types of cruise tracks are utilized depending on the river morphology of the segment being monitored. Due to the width of larger segments such as the York River Polyhaline (YRKPH), a series of tracks running parallel to the shoreline along fixed depth contours is followed. 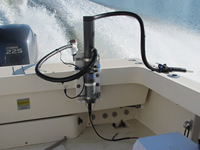 The track follows the shoreline along the <2 meter depth contour upriver, then turns down river following a mid depth contour (approximately 5 meters), it then goes upriver along the channel (>10 meters depth), then finishes with a down river leg along the other shoreline in the shallows. In narrower segments such as those in the Mattaponi and Pamunkey Rivers a single cruise track is used, traveling upriver to parallel the tidal advancement. Verification stations, five in each segment, are sampled for a number of parameters including total suspended solids, extracted chlorophyll, light attenuation, organic and inorganic nutrients, and dissolved oxygen via Winkler titration to verify that the YSI 6600 is functioning properly.
Continuous Monitoring
The continuous monitoring stations are used to monitor water quality parameters including depth, water temperature, salinity, pH, chlorophyll, turbidity, and dissolved oxygen using YSI 6600 data sondes with the Clean Sweep Extended Deployment System, which wipes the sensors at 15-minute intervals. These stations provide long term measurements that can be supplemented with shorter term monitoring, such as the DATAFLOW cruises, and other process-oriented studies. 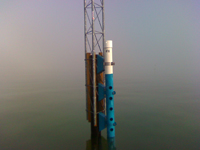 The fixed stations are designed to be free standing, away from piers and dock areas where boat traffic may lead to episodes of increased turbidity. The stations are placed at a depth of approximately 1.5 meters MLW. At each fixed station a piling is driven into the sediment and is surrounded by a protective frame. A perforated PVC pipe is mounted to the piling. Within the PVC housing, an YSI 6600 data logging sonde is secured 0.5 meters above the bottom. Sondes are deployed for a maximum of 7 - 10 days. Deployment duration is dependent upon the fouling regime of the area in which the sonde is located. Upon return to the laboratory the sondes are post calibrated, cleaned, and routine maintenance is performed as needed. The sondes are then stored until they are calibrated just prior to their next deployment. All calibrations and maintenance are completed in accordance with the YSI, Inc. operating manual methods (YSI 6-series Environmental Monitoring Systems Manual; YSI, Inc. Yellow Springs, OH).
Profiler Monitoring
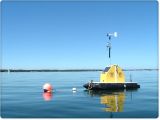
YSI Profiler systems, consisting of an integrated system of hardware and software, are currently being deployed from June through September in the deeper regions of the Rappahannock and York Rivers where severe hypoxia occurs in the warmer months. The vertical profiler is a fixed mounted system consisting of a multi-parameter YSI 6600 V2 data sonde, a computer controller (YSI 6960), and a motor-driven winch assembly (YSI 6955) that automatically collects hourly readings of temperature, salinity, conductivity, dissolved oxygen, pH, turbidity and chlorophyll from multiple depths along the depth profile. It uses a depth sounder to automatically compensate for varying tidal water levels. The controller is remotely accessed and programmed via telemetry and data is delivered hourly to a VIMS computer. A pier-based vertical profiler is positioned on a deep water US Coast Guard pier in the lower York River segment (YRKPH). A pontoon-based system is located in the Rappahannock River segment (RPPMH). Deployment duration is dependent upon the fouling regime of the area. At the end of each deployment the in situ multi-parameter data sonde is replaced with a newly calibrated unit. Upon return to the laboratory the previously deployed sonde is post calibrated, cleaned and routine maintenance is performed as needed. Each sonde is then stored until it is calibrated just prior to the next deployment. All calibrations and maintenance are completed in accordance with the YSI, Inc. operating manual methods (YSI 6-series Environmental Monitoring Systems Manual; YSI, Inc. Yellow spring, OH). The profiler data is updated annually on the VECOS website to include all data from the previous year.
Longterm Monitoring
As part of the Chesapeake Bay Monitoring Program, stations have been sampled routinely in the Virginia Mainstem Chesapeake Bay and the tidal portions of the major Virginia tributaries since 1985. Sampling frequency has varied from a maximum of 20 times per year in the early days of the monitoring program to 12 times per year more recently. Tributary stations are sampled by the Virginia Department of Environmental Quality. Mainstem Chesapeake stations were sampled by the Virginia Institute of Marine Science until 1996 when the monitoring program was taken over by Old Dominion University. Over the span of the monitoring program, 35 stations have been sampled consistently in the tributaries and 28 in the mainstem. In the mainstem monitoring program, a Yellow Springs Instruments (YSI) multi-parameter 6600V2 sampling probe is used to measure dissolved oxygen, pH, temperature, salinity and conductivity at 1 meter depth intervals at each station. At tributary stations, these parameters are measured using either a Hydrolab Datasonde 5 multi-probe, a YSI 600 XL multi-probe or a YSI 6920V2 multi-probe depending on location. Secchi depths are determined using a 20 inch diameter Secchi disc at all stations.
Data is provided via an external link to the Chesapeake Bay Program’s Data Hub web api. Data is maintained in the
Chesapeake Bay Program’s Water Quality Monitoring Database. A more customizable query form may be found Data is maintained in the
here.
Data Disclaimer
The data on this website should be considered provisional. It has passed rigorous quality assurance and quality control checks, but may be subject to change upon final review at the end of the calendar year. While we make every effort to provide correct and complete data in the graphs and image summaries, VIMS provides no warranty, expressed or implied, as to the accuracy, reliability or completeness of the furnished data. Data users are cautioned to consider carefully the provisional nature of the information before using it for decisions that concern personal or public safety or the conduct of business that involves substantial monetary or operational consequences.Information presented on this website is considered public information (unless otherwise noted) and maybe distributed or copied. Use of appropriate byline/photo/image credit is requested. Some of the documents on this server may contain live references to information created and maintained by other organizations. Please note that VIMS does not control and cannot guarantee the relevance, timeliness, or accuracy of these outside materials.
Error Codes for Shallow Water Monitoring Data
| Code | Description | Use Info |
| PSW | Salinity Calibrated to the Wrong Level | Probe issue: Data should not be used |
| PDP | DO Poisoning (Anoxia) | Probe issue: Data should not be used |
| GBO | Blocked Optic | Probe issue: Data should not be used |
| GWM | Wiper Malfunction | Probe issue: Data should not be used |
| GWL | Wiper Lost | Probe issue: Data should not be used |
| GSC | Seal Compromise | Probe issue: Data should not be used |
| GPF | Probe Failure | Probe issue: Data should not be used |
| GPC | Post Calibration Out of Range | Probe issue: Data should not be used |
| GNV | Negative Value | Probe issue: Data should not be used |
| NPF | Power Failure | Probe issue: Data should not be used |
| NOW | Instrument out of Water | Probe issue: Data should not be used |
| NNF | Ram Clogged/No Flow | Probe issue: Data should not be used |
| NND | No Data | Probe issue: Data should not be used |
| NIS | Invalid Data Due to Incorrect YSI Setup | Probe issue: Data should not be used |
| NIR | Instrument Removed | Probe issue: Data should not be used |
| NQR | Data Rejected Due to QA/QC Checks | Probe issue: Data should not be used |
| CTS | Time Skip | YSI instument skipped time. Time is adjusted. |
| CBF | Biofouling | Data questionable due to specific problem. |
| CWD | Instrument at Wrong Depth | Data questionable due to specific problem. |
| CTF | Temperature Probe Failure | Data questionable due to specific problem. |
| CSW | Salinity Level Calibrated at the Wrong Level | Data questionable due to specific problem. |
| CLF | Flow Low | Data questionable due to specific problem. |
| CDB | Disturbed Bottom | Data questionable due to specific problem. |
| CTC | Time Change | Notes daylight savings time change. Some data may be missing. |
| CTW | Turbid Water | Notes low water clarity at time of sampling. |
| CFK | Fish Kill | Notes fish kill at time of sampling. |
| CSC | Site Location Change | Notes change in station location. |
| CAS | Algal Sample Taken | Notes bloom at time of sampling and information about sampling collected. |
| CAB | Algal Bloom | Notes bloom at time of sampling. |
| CSF | Data Suspect After Final QA | Notes that data is suspect, but may be appropriate for some uses. |